In spring 2022, the original “Village People” (see Background) designed a survey to assess people’s opinions about The Village Revitalization. Then-students Marcuson and Totten shared our survey data with Fairmount Properties, the property group leading the redevelopment work in The Village. For this immersive learning class, we republished the survey in spring 2025 and below are the findings from 108 survey participants that have been collected since 2022. The survey may be used again in future classes.
How many times have you been to the village?
For this response, we have received 97 responses out of the total of 108 recorded. The data shows that, 19 (20%) of respondents have been to the village between 1 to 5 times, 7 (7%) of respondents have been to the village between 5 to 10 times, 18 (19%) of respondents have been to the village more than 10 times, 8 (8%) of respondents claim to go monthly to the village, 34 (35%) of respondents go to the village weekly, and 11 (11%) go to the village daily. We can conclude from this data that most people have visited it more than 10 times before and the majority visit the village weekly or daily.

What businesses do you go to in the village?
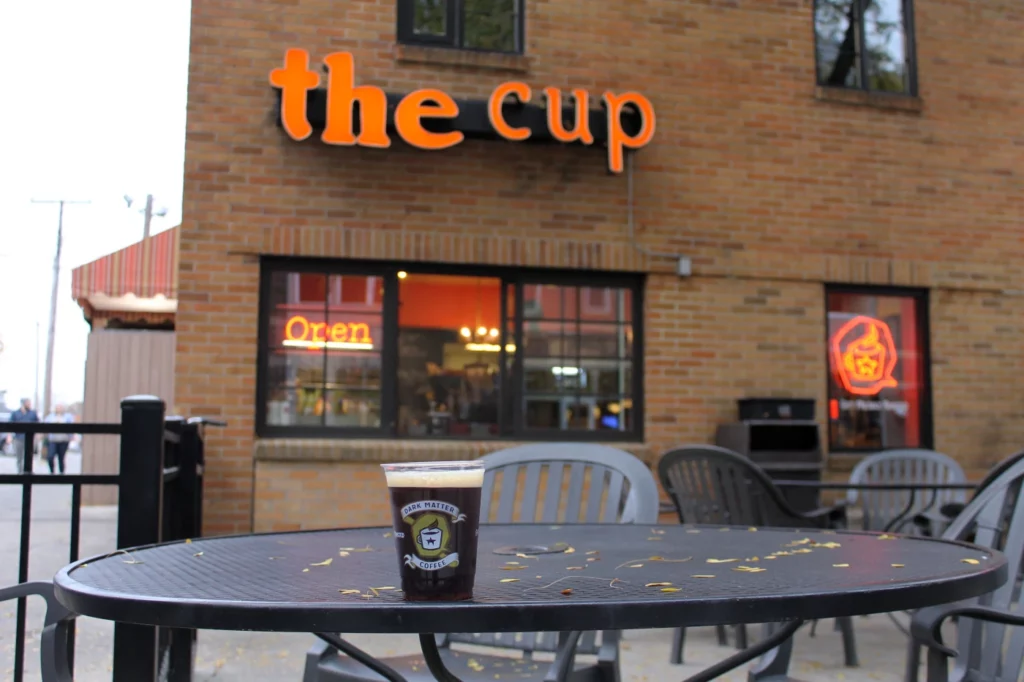
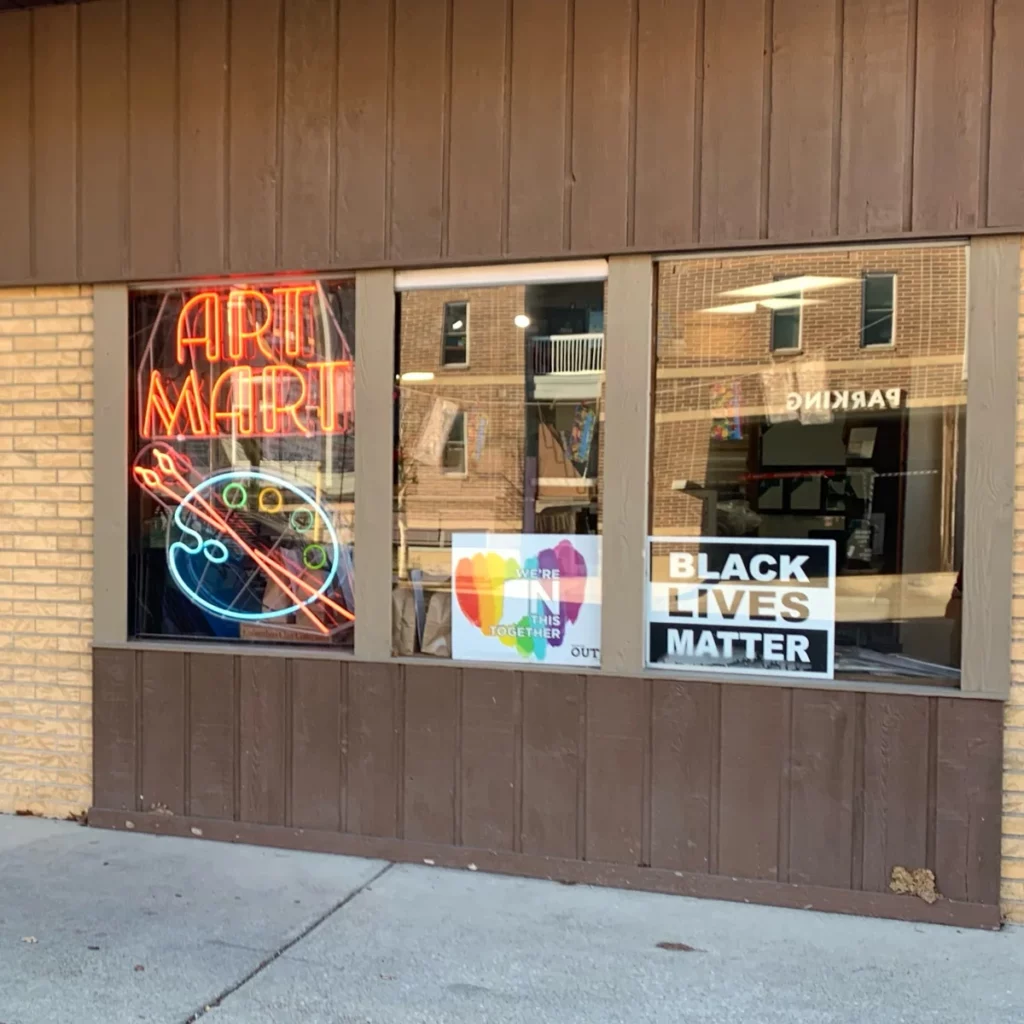
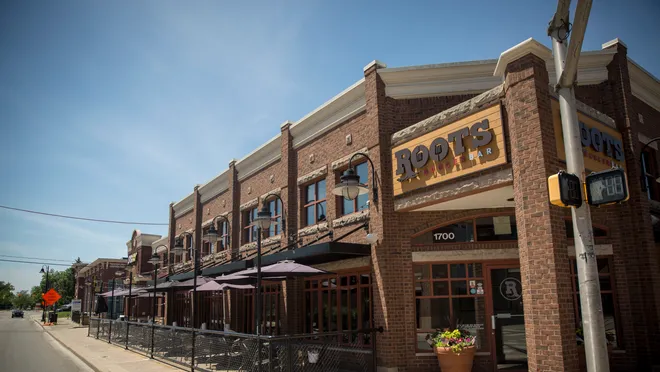
Out of the 108 responses that were recorded, only 68 people answered this question. We conducted data that shows the most popular places visited from the group of 68. We gathered all responses and then totaled them up to find the Smith’s S or salience of this data. Art mart had a salience of 0.21 which computes to 21% and was the most popular place visited in the village, The Cup was the second most visited place in the village with a salience of 0.17 or 17%, the third most visited place in the village was Roots with a salience of 0.13 or 13%, we can conclude from this data that the Art Mart, The Cup, and Roots are the most visited places in the village. Below are pictures of these three businesses that are most visited.
Who do you go to the village with?
This question was answered by 82 out of the 108 people who have taken this survey. The data shows that, 68 (83%) of people go to the village with their friends, 30 (37%) of respondents go to the village with their family, 35 (43%) of people go to the village with their partner, 17 (21%) of people go to the village with their colleagues for meetings or work, and 50 (61%) of people who go to the village, go by themselves, We can conclude from this data that majority of respondents are going to the village with theirs friends or by themselves.

How would you describe the Village?
For this question on our survey, we got 72 responses out of the 108 total people. We analyzed the data to find the salience of this question, here are the results. 0.17 or 17% of the respondents think the village is small, 0.14 or 14% think the village comes off as friendly, and 0.139 or 13.9% think the village is Run-down. From this data we analyzed and collected we can conclude that the Village is seen as Friendly but also as a small, run-down area.
Do you feel safe in the Village?
82 out of the total of 108 people answered this question on the survey, here is what the results said. 53 (65%) of people responded with yes, 3 (4%) responded with no, 26 (32%) of people responded with depends on. We can conclude from this data set, that majority of people feel safe when being in the village.
Do you feel safe in the village? (No, Depends on)
We analyzed the responses in which the respondent answered no or depends on and here is what we found. The salience data we found from the data is that, during the night hours, the village feels unsafe and unnerving. The people who answered depends on, we analyzed that data and here is the conclusion. 0.423 or 42.3% of people say it depends on the time of day, 0.19 or 19% of people say it depends on the location in the village, and 0.12 or 12% of people say that it depends on how dangerous it feels, We can conclude from this data set that the majority of people decide if the village is safe or not on the time of day or location in the village.

Do you feel welcome in the village as it is now?
For this question, we got a total of 81 responses out of the total 108 people. Here is what the data said, 60 (74%) of people say they feel welcome in the village, 3 (4%) of people say they do not feel welcome in the village, and 18 (22%) of people say they sometimes feel safe in the village. We can conclude that most people who answered this question feel safe in the village compared to those who don’t.
Do you feel welcome in the village as it is now? (No, Sometimes)
There were 4 responses for no but only 2 wrote something down, here are the results. One person said there is not much to do besides eat, another people said that they feel like the village is for the wealthier students. 18 people responded with sometimes but only 15 wrote specifically why only sometimes, here are the results. There were three with the same answer and highest percentage, only for students, parking and unfamiliar, all these came out with a salience of 0.143 or 14.3% which concluding that out of the 15 people that answered this response, these are the main problems with not feeling welcome.
What would you like to see in the village?
Out of the 108 total people who responded to the overall survey only 73 answered this question, here are the results. 0.501 or 50.1% of people responded that they wanted to see a grocery store in the village, 0.17 or 17% of people answered that they would like to see more restaurants in the village and 0.075 or 7.5% of people answered that they wanted a clothing store in the village. We can conclude from this data that more than half of the responses to this question want to see a grocery store in the village.
Which of the following best describes you?
For this question, we asked people whether they were Ball State students living on or off campus and had options for residents of Muncie who students weren’t, here are the results. There were 83 responses out of the total 108. 38 (46%) of people said they were Ball State students who lived on campus, 20 (24%) of people said they were Ball State students who lived off campus, 12 (14%) of people said they lived in Muncie and near the village and they were not associated with Ball State, 6 (7%) of people did not specify either of these options, 4 (5%) of people answered that they lived in Muncie but not close to the village or associated with Ball State, and 3 (4%) of people answered they live in Muncie but not near the village and work for Ball State. With this data we can conclude that more than half of the people who answered this survey were Ball State students who lived on or off campus.
What is your age?
Out of the 108 total people who answered the survey only 55 of those people were willing to give us their age. 14 (25% of people who answered said that they are 18 years old, 13 (24%) of people who answered said that they are 19 years old, 12 (22%) of people said that they are 20 years old, 7 (13%) of people say they are 22 years old, 4 (7%) of people said they are 21 years old, 2 (4%) of people said that they are 23 years old, and 3 (5%) of people said they are 24 years old or older. We can conclude from this set of data, majority or half of the people who answered this are most likely students at Ball State.

What academic year are you in?
For these questions, 55 people answered this question, which corresponds to the question of age beforehand. 19 (35%) of people answered they were in their freshmen year, 14 (25%) of people who answered said they are in their sophomore year, 10 (18%) of people said they are in their senior year, 6 (11%) of people said they are in their junior year, 3 (5%) of people said they are a 5th year senior, and 3 (5%) of people said they are in their graduate programs. We can conclude that exactly 50% of the people who answered this question are undergraduate students and the other half is upper class to graduate.
What is your gender identity?
For this question, only 55 people answered this out of the total of 108. 27 (49%) of people who answered this were female, 11 (20%) of people who answered this were male, 4 (7%) of people who answered are non-binary/third gender, 4 (7%) of people decided not to state their gender, and then 3 (5%) each, were transgender male, female or other. We can conclude from this that male and female were most people who a answered this survey.

What ethnic or racial category best describes you?
55 people answered this question on the survey which is more than half the total of people. 44 (80%) of people were white, 3 (5%) of people who answered this were Hispanic, Latinx, Chicanx, 4 (7%) of people who answered this question were African American/Black, 3 (5%) of people were mixed race or other races, 1 (2%) of people who answered were Middle Eastern or North African. We can conclude that most of the people who took this survey were white people. We would need a more robust set of data to have more diversity take this survey.
Do you live in a residence hall or an off-campus apartment or house?
Again, 55 people have responded to this question about their living status. 34 (62%) of people who answered live in dorm or residence halls on campus, 19 (35%) of people who answered live in an apartment or house off campus, and 2 (4%) of people live in the on-campus apartments. We can conclude from that data that most people who answered, are Muncie Residents and live near Ball State.
Are you Employed? If yes, do you work on campus?
For this question, we had 55 responses between yes or no. 31 (56%) of people said yes, they are employed, and 24 (44%) of people said they are not employed. 34 (69%) of people who answered do not work on campus or in the village, 14 (29%) of people work on campus jobs, and 1 (2%) of people have a job in the village. We can conclude from this data that people prefer off campus jobs rather than near or on campus.
How is your education being paid for?
We got 55 responses for this question, here is the data. 18 (33%) of people who answered, pay for their own education with help from financial aid or scholarships, 14 (25%) of people who answered, have their parents pay for their education with help from financial aid and scholarships, 8 (15%) of people answered, that their parents pay for their whole education, 7 (13%) of people who answered, said they pay for their own education, 4 (7%) of people who answered, pay for their education with help from loans, 3 (5%) of people answered that their parents pay for their education with help from loans, and 1 (2%) of people answered that their education is fully covered by scholarships or financial aid. We can conclude that most people whether it be students or parents paying for education, they rely on scholarships and financial aid to help most of it.
