Results
Subject Demographics
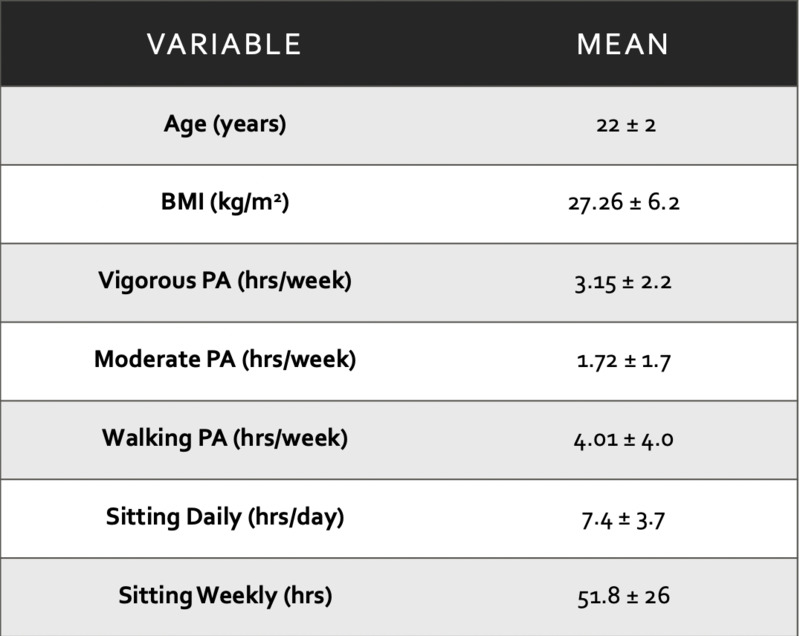
Five college aged participants (Years: 22 ± 2, BMI: 27 ± 6) completed both conditions of the present study. On average the participants engage in 3.2 ± 2.2 hours of vigorous intensity exercise, 1.7 ± 1.7 hours of moderate intensity exercise and 28.1 ± 27.9 hours walking per week. The average weekly sitting hours (51.6 ± 25 hours) indicates that the participants on average sit for more than 7 ± 3.7 hours per day.
Factor VII Results
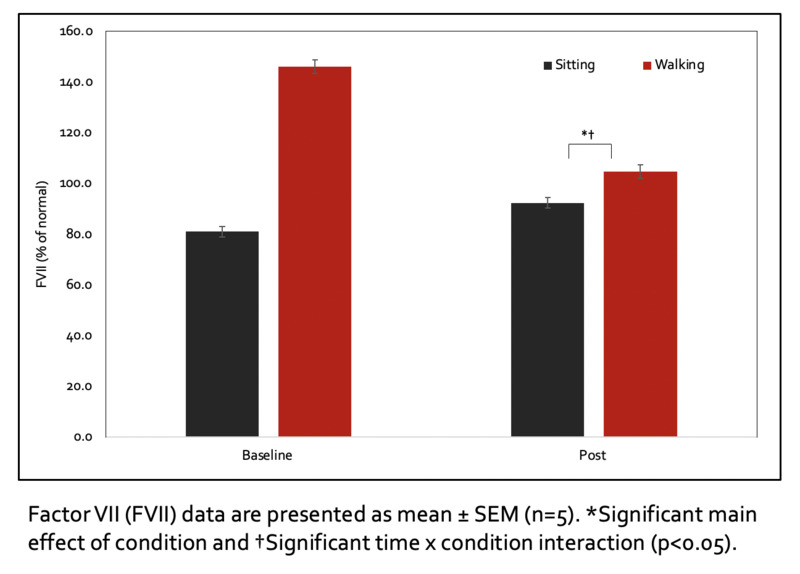
A significant effect of condition and time x condition interaction were observed for Factor VII (p<0.05 for both). A nonsignificant trend was observed for the main effect of time (p = 0.141, n2 = 0.455). During the sitting condition, Factor VII increased from 81.1 ± 15 to 92.4 ± 24.3% of normal, and during the walking condition it decreased from 146 ± 38.7 to 104.8 ± 21.6% of normal.
Factor VIII Results
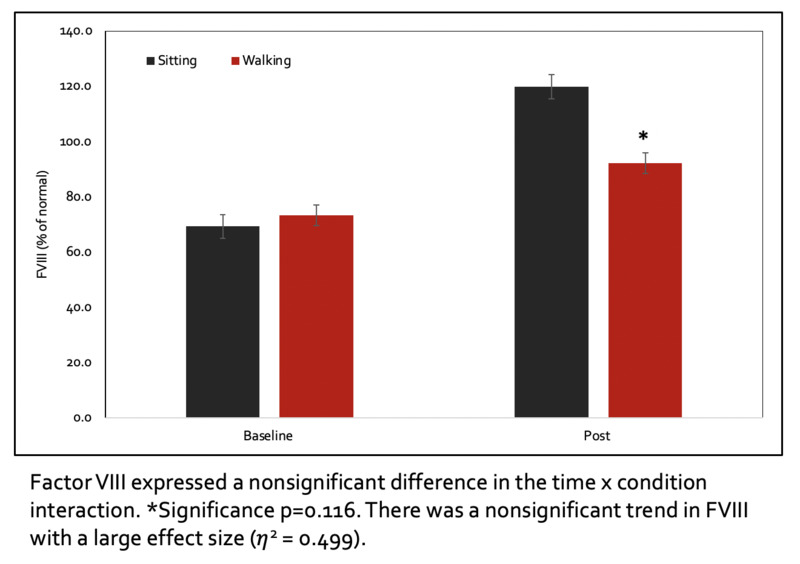
A nonsignificant finding was discovered for the time x condition interaction was found in FVIII (p = 0.116, n2 = 0.499). During the sitting condition, Factor VIII increased from 69.4 ± 27.1 to 119.9 ± 59.2% of normal and during the walking condition it increase to lesser amount 73.4 ± 21.7 to 92.2 ± 47.1% of normal.
APTT Results
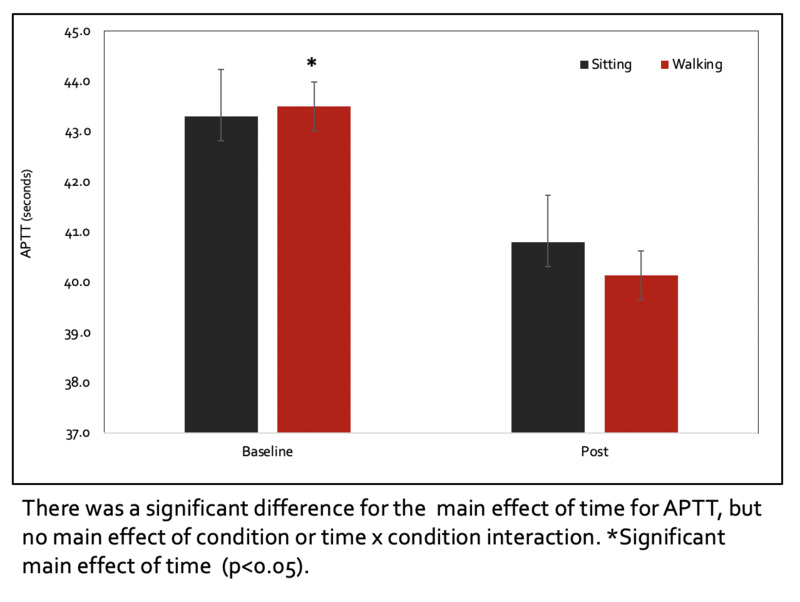
There was a significant main effect of time for APTT (p <0.05), but no main effect of condition or time x condition interaction. APTT decreased from 43.3 ± 6.3 to 40.8 ± 5.8 seconds during sitting, and from 43.5 ± 3.2 to 40.1 ± 3.1 seconds after walking.
PT Results
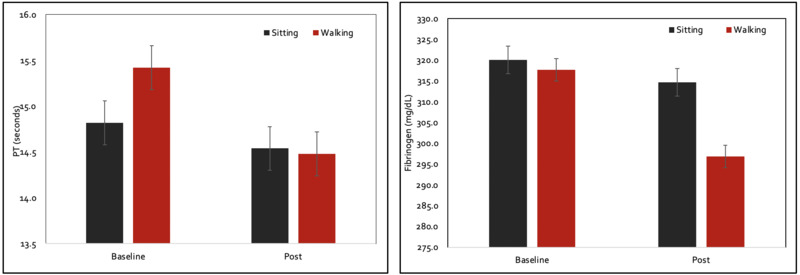
There was a nonsignificant main effect of time for PT (p = 0.184, n2 = 0.391). The difference from baseline to post sitting was 14.8 ± 1.2 to 14.5 ± .59 seconds, and baseline to post walking was from 15.4 ± 1.1 to 14.5 ± .74 seconds.
Fibrinogen Results
There was a nonsignificant time x condition interaction found in fibrinogen (p = 0.596, n2 = 0.391). The difference between time and the sitting condition were 320 ± 67.2 to 314.6 ± 51.1 mg/dL and the changes between time and the walking condition were from 317.7 ± 53.3 to 296.9 ± 40.6 mg/dL.
Task Performance and Mood Outcomes
Out of the eleven tasks completed by the participants there was one significant difference between the two conditions, The Stroop Color and Word Test (p<0.05). On average, the participants performed better while walking on the treadmill compared to sitting (ST: 64.6 ± 9.4, W: 58.2 ± 8.4). While there was only one significant difference within the group of tasks, typing the US Grant document, there were more errors recorded while using the sedentary workstation compared to the active workstation (ST: 27.6 ± 20.6, W: 22.4 ± 6.6). Even though this difference was not statistically different (p = 0.80), the effect size (n2 = .575) suggests that 57.5% of the outcome is due to the difference in condition. The participants were calmer during the sedentary condition (ST: 3.40 ± .89, W: 3.20 ± 1.1), but also more tired (ST: 3.40 ± .89, W: 2.40 ± .56), and worn-out (ST: 1.80 ± .84, W: 1.60 ± .55) after completing the tasks (all p<0.05).

