Materials and Methods

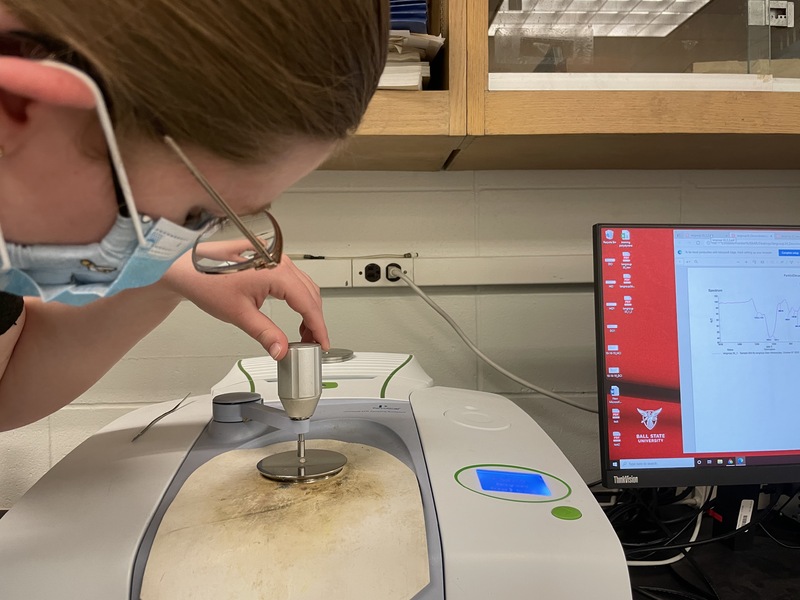
Figure 2. Emma Cieslik adjusting the clamp on the Perkins FTIR that facilitates contact between the sample and the diamond.

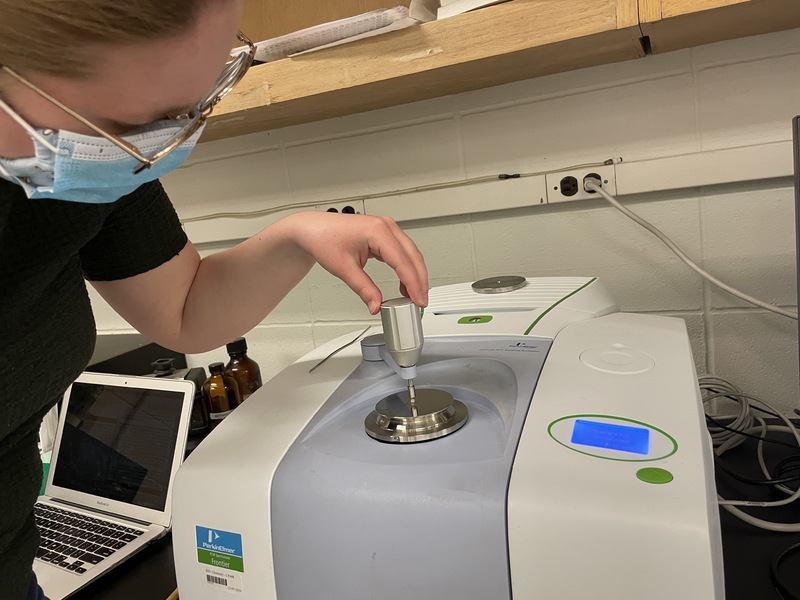
Figure 2. Broader view of Perkins FTIR showing the location of the clamp.

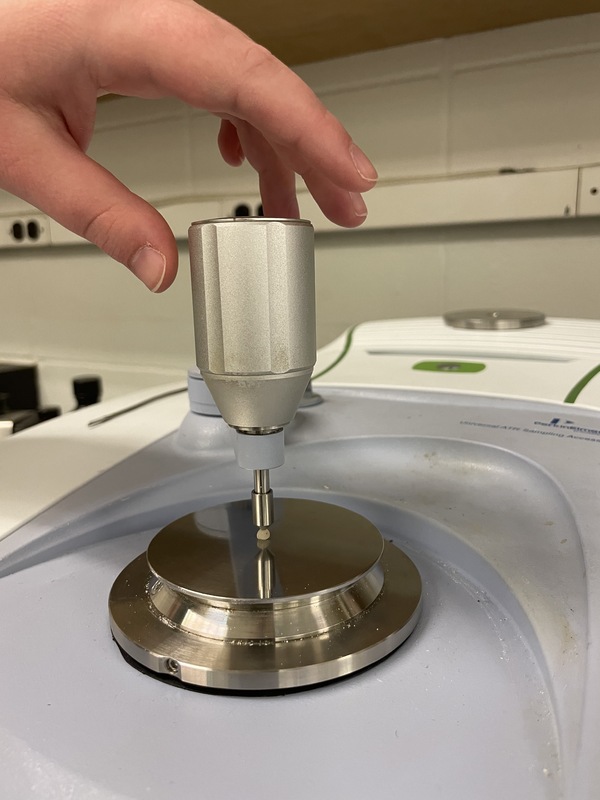
Figure 4. Up-close view of the clamp, the sample and the diamond on the Perkins FTIR. Note the close contact between the sample and the surface.
Infrared spectra were obtained using a Perkin-Elmer Frontier Fourier Transform Infrared (FTIR) spectrometer with the Attenuated Total Reflection (ATR) diamond accessory at 4 cm-1 resolution with 10 signal-averaged scans. The spectra were obtained between 4000 and 600 cm-1.
Buttons placed directly on the ATR crystal did not yield adequate contact to provide infrared absorbance under pressure due to their hardness and shape. Therefore, they were sampled by placing each in a machine vice and slicing or chiseling until small pieces were formed, about 1 by 2 mm square. That size yielded an adequate, though not optimum infrared spectrum.
Due to the broadness of the infrared absorbances the unprocessed spectra were then deconvolved at a 19.5 or 25 deconvolution level with a smoothing factor of 95 and a Bessel function to more accurately determine the location of peaks. Further, a fourth derivative of the spectra were obtained to check the validity of the peaks. Replicate spectra of each button were obtained.
