Unprocessed FTIR, Deconvolution and 4th Derivative Spectra
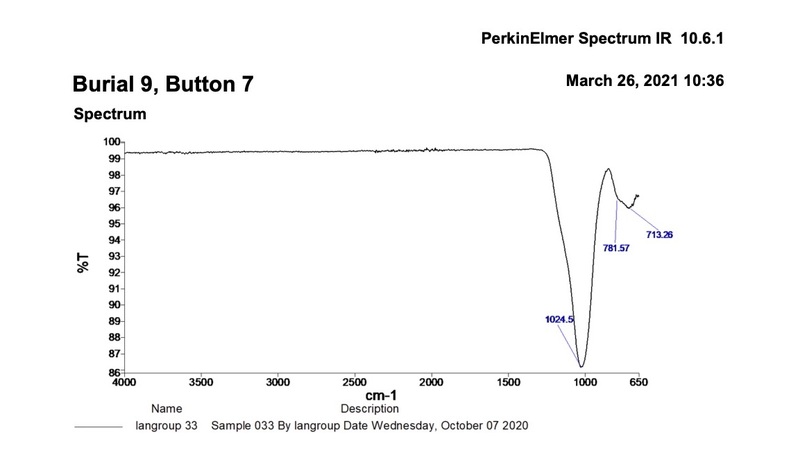
In all the unprocessed spectra, there is an intense, broad peak centered at about 1038 cm-1, as well as a broad but much weaker peak at about 713 cm-1. An example of a typical unprocessed spectrum is shown in Figure 5. If we only consider the most intense peak at 1038 cm-1, literature suggests it could indicate fired clay or metaclay (Shoval 2017).
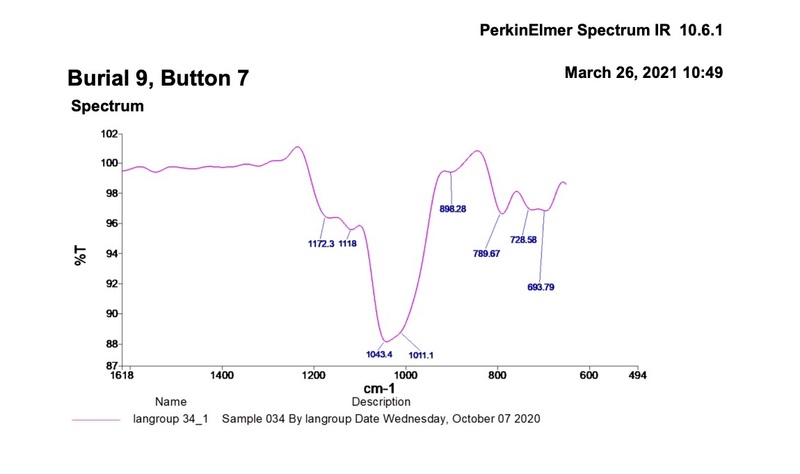
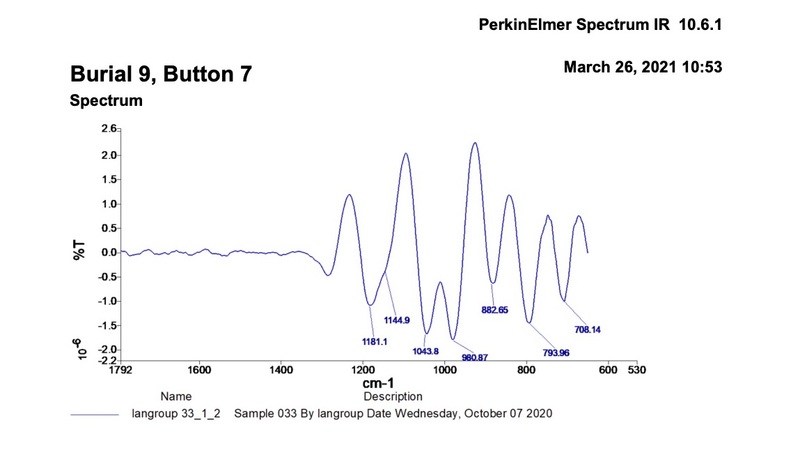
After deconvolution, see Figure 6, we see that the most intense peak deconvolves into two peaks around 1049 and and a shoulder at 995 cm-1. The former peak is consistent with clay or meta clay referred to earlier, while the latter peak is consistent with the presence of feldspar and/or an alumnosilicate according to literature (Barilaro et al. 2005) as well as well as according to reference spectra of different feldspars. These two bands are verified in the 4th derivative spectra and are located between 1027-1054 and 963-993 cm-1.


